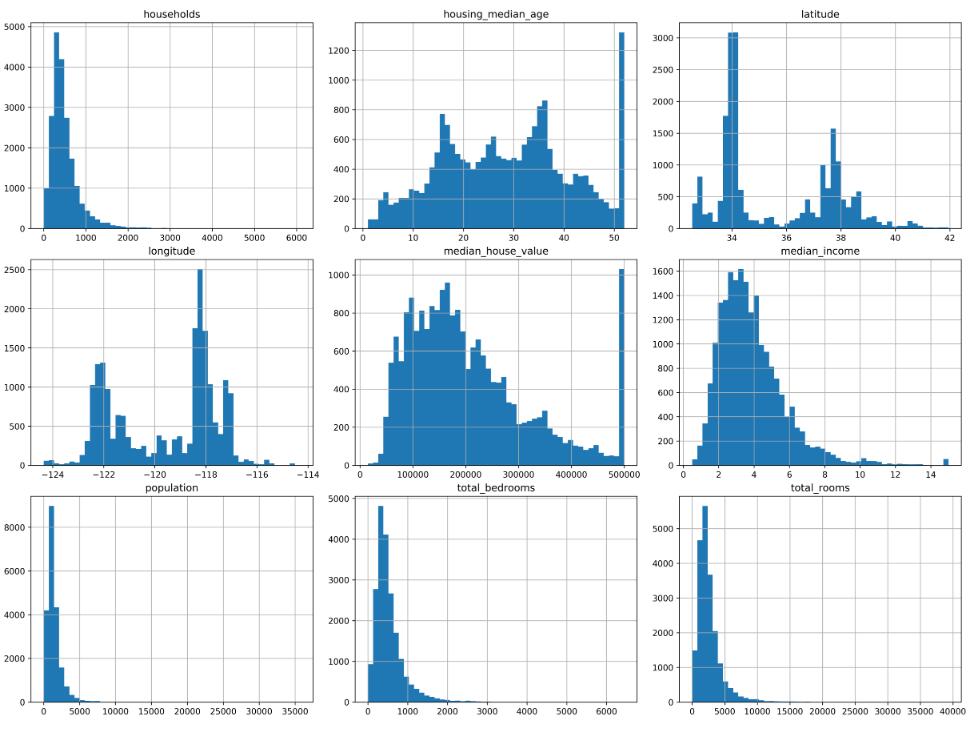
如下所示:
plt.subplots_adjust(left=None,bottom=None,right=None,top=None,wspace=0.15,hspace=0.15)
圖與圖之間的間距調(diào)整

補充:python如何調(diào)整subplot的間距
https://matplotlib.org/api/_as_gen/matplotlib.pyplot.subplots_adjust.html
plt.subplots_adjust(left=None, bottom=None, right=None, top=None,
                wspace=None, hspace=None)
left  = 0.125  # the left side of the subplots of the figure
right = 0.9    # the right side of the subplots of the figure
bottom = 0.1   # the bottom of the subplots of the figure
top = 0.9      # the top of the subplots of the figure
wspace = 0.2   # the amount of width reserved for blank space between subplots,
               # expressed as a fraction of the average axis width
hspace = 0.2   # the amount of height reserved for white space between subplots,
               # expressed as a fraction of the average axis height
以上為個人經(jīng)驗��,希望能給大家一個參考��,也希望大家多多支持腳本之家���。
您可能感興趣的文章:- Python tkinter布局與按鈕間距設(shè)置方式
- Python數(shù)據(jù)分析matplotlib設(shè)置多個子圖的間距方法
- matplotlib調(diào)整子圖間距,調(diào)整整體空白的方法
- matplotlib subplots 調(diào)整子圖間矩的實例