目錄
- 一��、散點圖
- 二���、柱狀圖
- 三、直方圖
- 四��、扇形圖
- 總結
一����、散點圖
散點圖用兩組數(shù)據(jù)構成多個坐標點,考察坐標點的分布���,判斷兩變量之間是否存在某種關聯(lián)或總結坐標點的分布模式��。
特點:判斷變量之間是否存在數(shù)量關聯(lián)趨勢�,表示離群點的分布規(guī)律�。
散點圖繪制:
plt.scatter(x,y) # 以默認的形狀顏色繪制散點圖
實例: 假設我們獲取到了上海2020年5,10月份每天白天的最高氣溫(分別位于列表a、b)��,那么此時如何觀察氣溫和隨時間變化的某種規(guī)律�����。
# 繪制圖形所需的數(shù)據(jù)
y_5 = [11,17,16,11,12,11,12,13,10,14,8,13,12,15,14,17,18,21,16,17,30,14,15,15,15,19,21,22,22,22,23]
y_10 = [26,26,28,19,21,17,16,19,18,20,20,19,22,23,17,20,21,20,22,15,11,15,5,13,15,10,11,13,12,13,6]
代碼如下:
import matplotlib.pyplot as plt

# 設置字體
plt.rcParams['font.sans-serif']=['SimHei'] # 替換sans_serif字體
plt.rcParams['axes.unicode_minus']=False # 解決坐標軸負數(shù)的負號顯示問題

plt.figure(figsize=(12,5), dpi=100)

y_5 = [11,17,16,11,12,11,12,13,10,14,8,13,12,15,14,17,18,21,16,17,30,14,15,15,15,19,21,22,22,22,23]
y_10 = [26,26,28,19,21,17,16,19,18,20,20,19,22,23,17,20,21,20,22,15,11,15,5,13,15,10,11,13,12,13,6]
x = range(1, 32)

plt.scatter(x, y_5, label='五月份')
plt.scatter(x, y_10, label='十月份')

# 增加標題,坐標描述
plt.xlabel("時間")
plt.ylabel("日期")
plt.title("氣溫和隨時間變化的某種規(guī)律")

# 添加圖形注釋
plt.legend(loc='best')

plt.show()
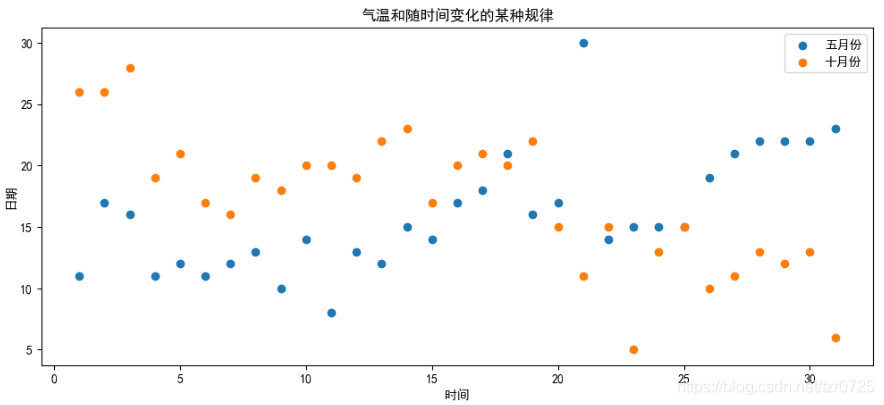
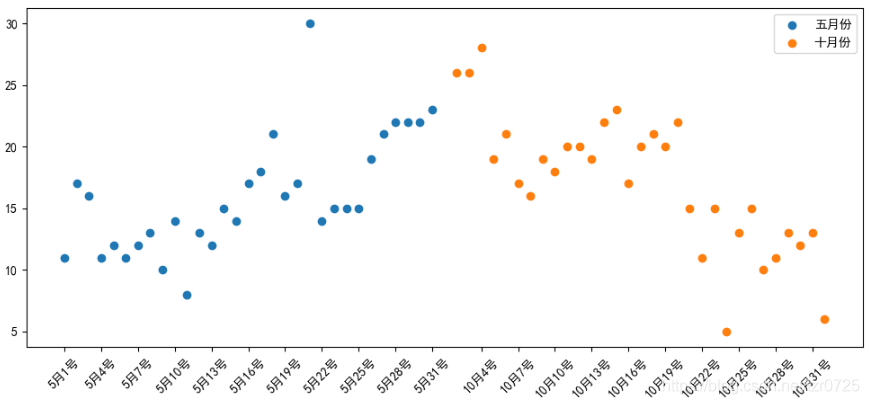
上圖雖然繪制出5�����、10月氣溫隨日期的變化����,但兩者混在一起,不便于觀察���,現(xiàn)通過修改x數(shù)據(jù)�����,將10月的坐標點集體往坐標軸右側移動��,改進的代碼如下:
import matplotlib.pyplot as plt

# 設置字體
plt.rcParams['font.sans-serif']=['SimHei'] # 替換sans_serif字體
plt.rcParams['axes.unicode_minus']=False # 解決坐標軸負數(shù)的負號顯示問題

plt.figure(figsize=(12,5), dpi=100)

y_5 = [11,17,16,11,12,11,12,13,10,14,8,13,12,15,14,17,18,21,16,17,30,14,15,15,15,19,21,22,22,22,23]
y_10 = [26,26,28,19,21,17,16,19,18,20,20,19,22,23,17,20,21,20,22,15,11,15,5,13,15,10,11,13,12,13,6]
x_5 = range(1, 32)
x_10 = range(33, 64)

plt.scatter(x_5, y_5, label='五月份')
plt.scatter(x_10, y_10, label='十月份')

# 刻度顯示
x_t = list(x_4)+list(x_10)
x_l = ["5月{}號".format(i) for i in x_4]
x_l += ["10月{}號".format(i-31) for i in x_10]
plt.xticks(x_t[::3], x_l[::3], rotation=45)

# 添加圖形注釋
plt.legend(loc='best')

plt.show()
二�、柱狀圖
柱狀圖是用寬度相同的條形的高度或長短來表示數(shù)據(jù)多少的圖形��。柱狀圖可以橫置或縱置���,縱置時也稱為柱形圖��。
特點:
能夠直觀反映出各個數(shù)據(jù)的大?��?����;
易于比較數(shù)據(jù)之間的差別。
柱狀圖繪制:
plt.bar(x, width, align=‘center', **kwargs)
Parameters:
x : sequence of scalars.

width : scalar or array-like, optional, 柱狀圖的寬度

align: {‘center', ‘edge'}, optional, default: ‘center'
Alignment of the bars to the x coordinates:
‘center': Center the base on the x positions.
‘edge': Align the left edges of the bars with the x positions.
每個柱狀圖的位置對齊方式, 默認柱狀圖的中心與x坐標中心對齊

**kwargs:
color: 選擇柱狀圖的顏色
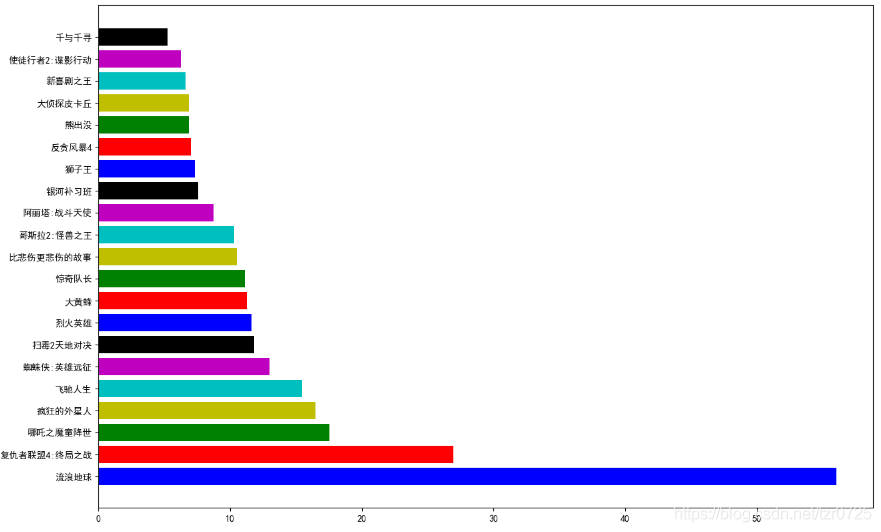
水平條形圖繪制
plt.barh(y, width) # 繪制以y為y軸位置的水平條形圖
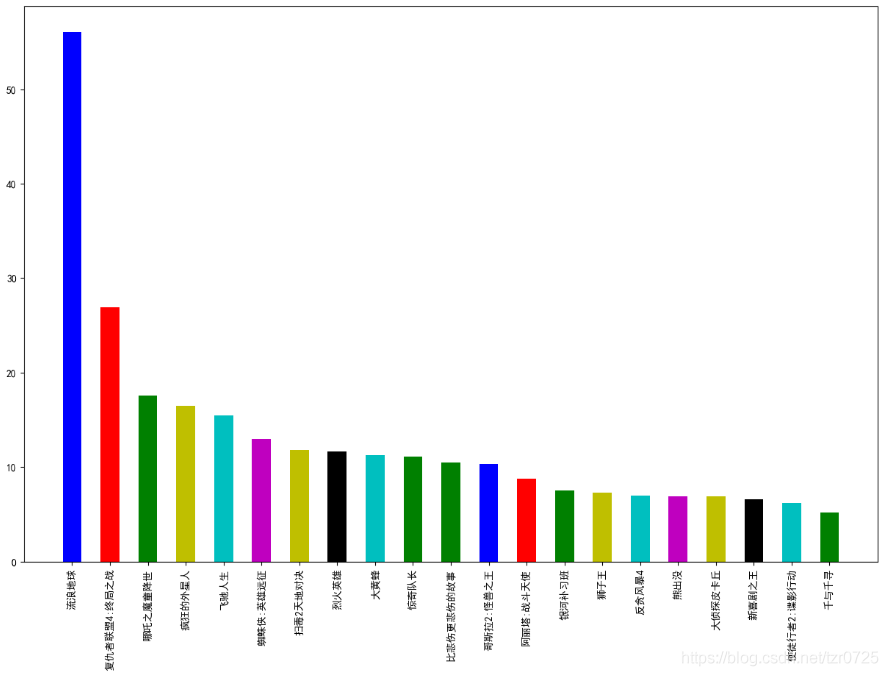
實例:假設我們獲取到了2019年內(nèi)地電影票房前20的電影(列表a)和電影票房數(shù)據(jù)(列表b)����,繪制柱狀圖直觀地展示數(shù)據(jù),代碼如下:
import matplotlib.pyplot as plt
# 設置字體
plt.rcParams['font.sans-serif']=['SimHei'] # 替換sans_serif字體
plt.rcParams['axes.unicode_minus']=False # 解決坐標軸負數(shù)的負號顯示問題
plt.figure(figsize=(15,10),dpi=100)
# 準備電影的名字以及電影的票房數(shù)據(jù)
movie_name = ["流浪地球","復仇者聯(lián)盟4:終局之戰(zhàn)","哪吒之魔童降世","瘋狂的外星人",
"飛馳人生","蜘蛛俠:英雄遠征","掃毒2天地對決","烈火英雄","大黃蜂",
"驚奇隊長","比悲傷更悲傷的故事","哥斯拉2:怪獸之王","阿麗塔:戰(zhàn)斗天使",
"銀河補習班","獅子王","反貪風暴4","熊出沒","大偵探皮卡丘","新喜劇之王",
"使徒行者2:諜影行動","千與千尋"]
y = [56.01,26.94,17.53,16.49,15.45,12.96,11.8,11.61,
11.28,11.12,10.49,10.3,8.75,7.55,7.32,6.99,6.88,6.86,6.58,6.23,5.22]
# 放進橫坐標的數(shù)字列表
x = range(len(movie_name))
# 畫出條形圖
# 顏色color參數(shù)表示條形圖的順序顏色����,可循環(huán)
plt.bar(x, y, width=0.5, color=['b','r','g','y','c','m','y','k','c','g','g'])
# 修改刻度名稱,并旋轉90度
plt.xticks(x, movie_name, rotation=90)
# 展示圖形
plt.show()
# 水平條形圖
plt.figure(figsize=(15,10),dpi=100)
plt.barh(movie_name, y, color=['b','r','g','y','c','m','k'])
plt.show()
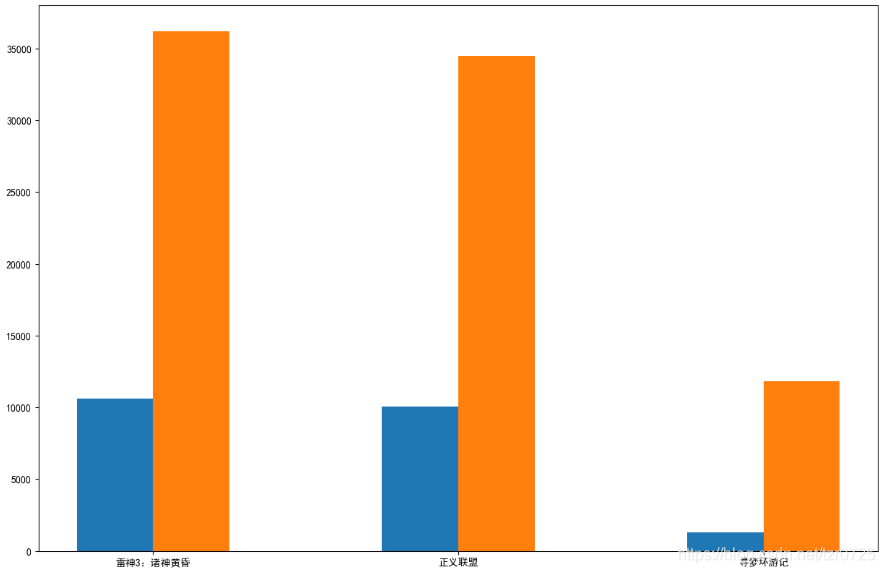
有時候為了公平起見�����,我們需要對比不同電影首日和首周的票房收入�����,讓數(shù)據(jù)更有說服力��。假設數(shù)據(jù)如下:
movie_name = ['雷神3:諸神黃昏','正義聯(lián)盟','尋夢環(huán)游記']
first_day = [10587.6,10062.5,1275.7] # 首日票房
first_weekend=[36224.9,34479.6,11830] # 首周票房
繪制不同電影首日和首周票房的數(shù)據(jù)圖���,代碼如下:
import matplotlib.pyplot as plt
# 設置字體
plt.rcParams['font.sans-serif']=['SimHei'] # 替換sans_serif字體
plt.rcParams['axes.unicode_minus']=False # 解決坐標軸負數(shù)的負號顯示問題
plt.figure(figsize=(15,10),dpi=100)
# 準備數(shù)據(jù)
movie_name = ['雷神3:諸神黃昏','正義聯(lián)盟','尋夢環(huán)游記']
# 構造首日票房����,首周票房數(shù)據(jù)
first_day = [10587.6,10062.5,1275.7]
first_weekend=[36224.9,34479.6,11830]
x = range(len(movie_name))
# 繪制第一個柱狀圖
plt.bar(x, first_day, width=0.25)
# 接著繪制第二個柱狀圖
plt.bar([i+0.25 for i in x], first_weekend, width=0.25)
# 修改刻度名稱
# 顯示x軸中文,固定在首日和首周的中間位置
plt.xticks([i+0.125 for i in x], movie_name)
plt.show()
注意點:
x軸坐標刻度顯示位置的調(diào)整���,既可以通過繪制圖形時調(diào)整x數(shù)據(jù)����,也可以通過繪制x軸刻度時調(diào)整刻度的方法來實現(xiàn)x軸刻度顯示在兩個柱狀圖中間�����。如果不做任何調(diào)整����,它是默認與第一個柱狀圖中間對齊的。
三���、直方圖
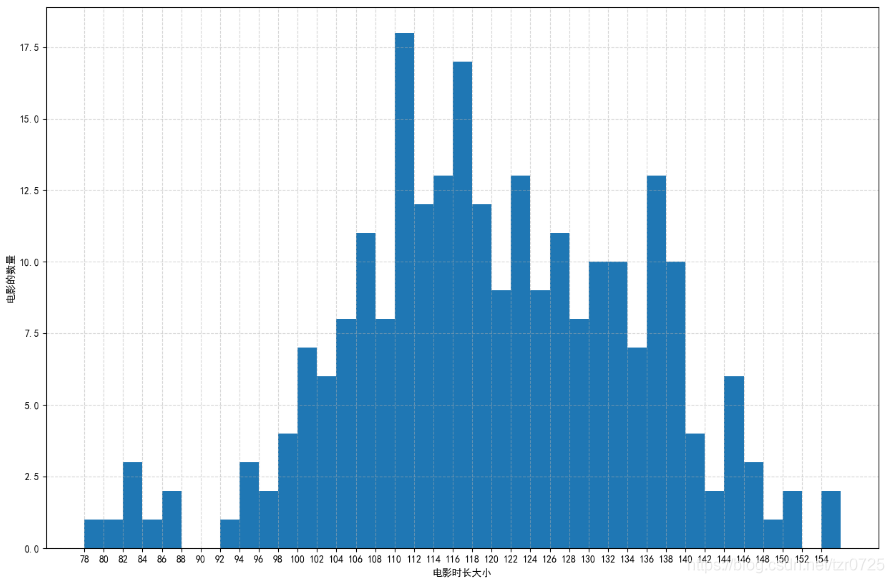
直方圖����,形狀類似柱狀圖卻有著與柱狀圖完全不同的含義���。直方圖牽涉統(tǒng)計學的概念�,首先要對數(shù)據(jù)進行分組,然后統(tǒng)計每個分組內(nèi)數(shù)據(jù)元的數(shù)量����。 在坐標系中,橫軸標出每個組的端點����,縱軸表示頻數(shù)�����,每個矩形的高代表對應的頻數(shù)�����,稱這樣的統(tǒng)計圖為頻數(shù)分布直方圖��。
特點:繪制連續(xù)性的數(shù)據(jù)����,展示一組或者多組數(shù)據(jù)的分布情況,用于統(tǒng)計數(shù)據(jù)分布的特征�。
相關概念:
組數(shù):在統(tǒng)計數(shù)據(jù)時����,把數(shù)據(jù)按照不同的范圍分成幾個組���,分成的組的個數(shù)稱為組數(shù)���;
組距:每一組兩個端點的差。
直方圖繪制
plt.hist(x,bins=None)
繪制以x為數(shù)值���,bins為組數(shù)���,組數(shù) = 極差/組距
實例:假設我們獲取到了一些電影的時長,繪制直方圖展示電影時長的分布情況�����,代碼如下:
import matplotlib.pyplot as plt
# 設置字體
plt.rcParams['font.sans-serif']=['SimHei'] # 替換sans_serif字體
plt.rcParams['axes.unicode_minus']=False # 解決坐標軸負數(shù)的負號顯示問題
plt.figure(figsize=(15,10),dpi=100)
# 準備數(shù)據(jù)���,電影時長
time =[131, 98, 125, 131, 124, 139, 131, 117, 128, 108,
135, 138, 131, 102, 107, 114, 119, 128, 121, 142,
127, 130, 124, 101, 110, 116, 117, 110, 128, 128,
115, 99, 136, 126, 134, 95, 138, 117, 111, 78,
132, 124, 113, 150, 110, 117, 86, 95, 144, 105,
126, 130,126, 130, 126, 116, 123, 106, 112, 138,
123, 86, 101, 99, 136,123, 117, 119, 105, 137,
123, 128, 125, 104, 109, 134, 125, 127,105, 120,
107, 129, 116, 108, 132, 103, 136, 118, 102, 120,
114,105, 115, 132, 145, 119, 121, 112, 139, 125,
138, 109, 132, 134,156, 106, 117, 127, 144, 139,
139, 119, 140, 83, 110, 102,123,107, 143, 115,
136, 118, 139, 123, 112, 118, 125, 109, 119, 133,
112, 114, 122, 109, 106, 123, 116, 131, 127, 115,
118, 112, 135,115, 146, 137, 116, 103, 144, 83,
123, 111, 110, 111, 100, 154,136, 100, 118, 119,
133, 134, 106, 129, 126, 110, 111, 109, 141, 120,
117, 106, 149, 122, 122, 110, 118, 127, 121, 114,
125, 126,114, 140, 103, 130, 141, 117, 106, 114,
121, 114, 133, 137, 92,121, 112, 146, 97, 137,
105, 98, 117, 112, 81, 97, 139, 113,134, 106,
144, 110, 137, 137, 111, 104, 117, 100, 111, 101,
110, 105, 129, 137, 112, 120, 113, 133, 112, 83,
94, 146, 133, 101, 131, 116, 111, 84, 137, 115,
122, 106, 144, 109, 123, 116, 111,111, 133, 150]
# 組距
bins = 2
# 組數(shù)����,極差/組距
groups = int((max(time) - min(time)) / 2)
# 繪制直方圖
plt.hist(time, groups)
# 指定x軸刻度的范圍
plt.xticks(list(range(min(time), max(time)))[::2])
# 添加坐標描述
plt.xlabel('電影時長大小')
plt.ylabel('電影的數(shù)量')
# 增加網(wǎng)格顯示
plt.grid(True, linestyle='--', alpha=0.5)
plt.show()
四、扇形圖
扇形圖����,用整個圓表示總數(shù),用圓內(nèi)各個扇形的大小表示各部分數(shù)量占總數(shù)的百分數(shù)�����。
扇形圖繪制
plt.pie(x, explode=None, labels=None)
x:扇形數(shù)據(jù)
explode:設置某幾個分塊是否要分離餅圖
labels:每塊扇形標簽
autopct:百分比數(shù)據(jù)標簽
shadow:是否顯示陰影
plt.pie()有3個返回值:
patches:繪制餅圖每一塊的對象
texts:文本的列表
autotexts:百分比的文本列表
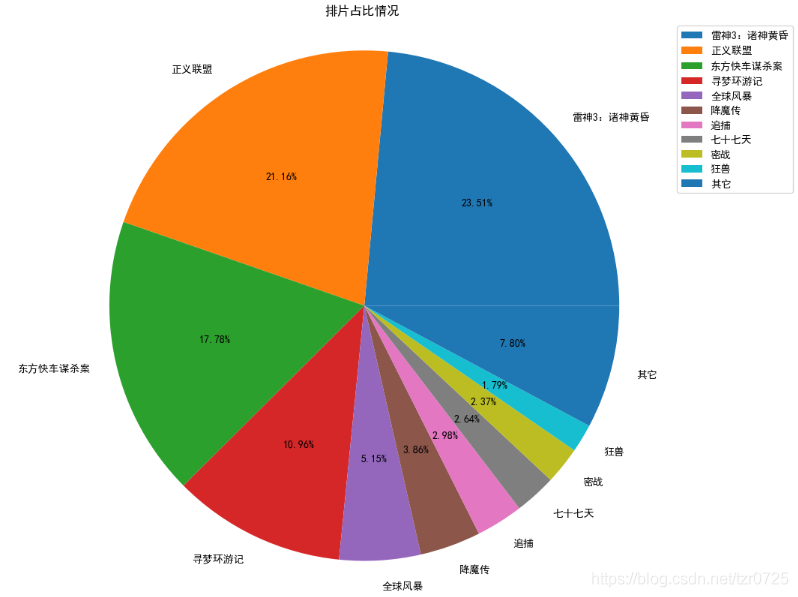
實例:假設我們獲取到了一些電影的排片數(shù)據(jù)�,繪制扇形圖展示電影的排片占比情況,代碼如下:
import matplotlib.pyplot as plt
# 設置字體
plt.rcParams['font.sans-serif']=['SimHei'] # 替換sans_serif字體
plt.rcParams['axes.unicode_minus']=False # 解決坐標軸負數(shù)的負號顯示問題

# 餅圖繪制
plt.figure(figsize=(15, 10), dpi=100)
# 電影排片數(shù)據(jù)
movie_name = ['雷神3:諸神黃昏','正義聯(lián)盟','東方快車謀殺案','尋夢環(huán)游記','全球風暴','降魔傳','追捕','七十七天','密戰(zhàn)','狂獸','其它']
place_count = [60605,54546,45819,28243,13270,9945,7679,6799,6101,4621,20105]

# 繪制扇形圖
plt.pie(place_count, labels=movie_name, autopct="%1.2f%%")

# 指定顯示的pie是正圓
plt.axis('equal')

# 設置圖例和標題
plt.legend(loc="best")
plt.title("排片占比情況")

plt.show()
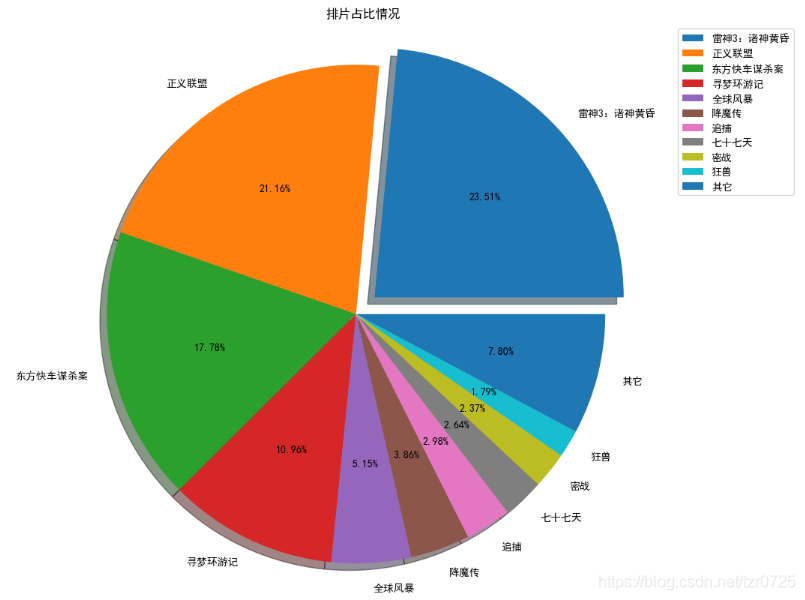
扇形圖優(yōu)化的手段添加陰影����,分離特定數(shù)據(jù)等:
import matplotlib.pyplot as plt
# 設置字體
plt.rcParams['font.sans-serif']=['SimHei'] # 替換sans_serif字體
plt.rcParams['axes.unicode_minus']=False # 解決坐標軸負數(shù)的負號顯示問題

plt.figure(figsize=(15, 10), dpi=100)
movie_name = ['雷神3:諸神黃昏','正義聯(lián)盟','東方快車謀殺案','尋夢環(huán)游記','全球風暴','降魔傳','追捕','七十七天','密戰(zhàn)','狂獸','其它']
place_count = [60605,54546,45819,28243,13270,9945,7679,6799,6101,4621,20105]

# 繪制扇形圖,添加陰影效果,并讓占比最大的雷神3分離
explode = [0.1, 0, 0, 0, 0, 0, 0, 0, 0, 0, 0]
res = plt.pie(place_count, labels=movie_name, explode=explode, autopct="%1.2f%%", shadow=True)
patches, texts, autotexts = res
print(patches)  # 表示每個扇形的對象
print(texts)  # 每個文本對象
print(autotexts)  # 每個百分比對象

# 指定顯示的pie是正圓
plt.axis('equal')

# 設置圖例和標題
plt.legend(loc="best")
plt.title("排片占比情況")

plt.show()
打印的扇形圖返回值:

優(yōu)化后的扇形圖:
總結
本文講述了使用Matplotlib繪制散點圖�、柱狀圖�、直方圖、扇形圖的基本操作�����。
到此這篇關于Python數(shù)據(jù)可視化之用Matplotlib繪制常用圖形的文章就介紹到這了,更多相關Matplotlib繪制圖形內(nèi)容請搜索腳本之家以前的文章或繼續(xù)瀏覽下面的相關文章希望大家以后多多支持腳本之家��!
您可能感興趣的文章:- 利用Python進行數(shù)據(jù)可視化的實例代碼
- python數(shù)據(jù)可視化之matplotlib.pyplot基礎以及折線圖
- 淺談哪個Python庫才最適合做數(shù)據(jù)可視化
- python數(shù)據(jù)可視化plt庫實例詳解
- 學會Python數(shù)據(jù)可視化必須嘗試這7個庫
- Python中seaborn庫之countplot的數(shù)據(jù)可視化使用
- python實現(xiàn)股票歷史數(shù)據(jù)可視化分析案例
- Python數(shù)據(jù)可視化之基于pyecharts實現(xiàn)的地理圖表的繪制
- Python爬蟲實戰(zhàn)之爬取京東商品數(shù)據(jù)并實實現(xiàn)數(shù)據(jù)可視化
- Python數(shù)據(jù)可視化之繪制柱狀圖和條形圖
- python用pyecharts實現(xiàn)地圖數(shù)據(jù)可視化
- python數(shù)據(jù)可視化 – 利用Bokeh和Bottle.py在網(wǎng)頁上展示你的數(shù)據(jù)